Direct Line 831.566.3127     Email Kathleen.manning@sothebys.realty     License: DRE# 00885315
Kathleen Manning

Kathleen Manning

Carmel


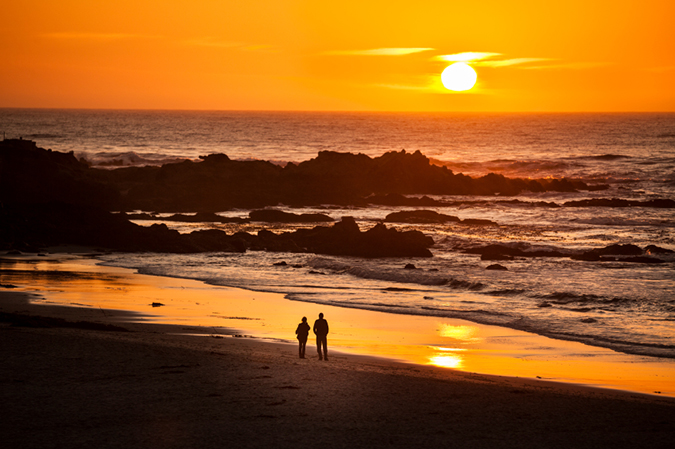
Carmel-by-the-Sea is located in a   lush, green setting just off Highway 1, five miles south of Monterey and 26 miles north of Big Sur. Resembling a quaint, European-style village, Carmel is best known for its winding tree-lined streets, fine restaurants, cozy inns, and unique boutiques. With its breathtaking natural beauty, the community has historically drawn artists from around the world. Today, nearly 90 art galleries are located throughout the village.

Also known for its outstanding selection of performing arts, Carmel is home to California’s first outdoor amphitheater, the Forest Theater. A popular venue for local productions, the theater hosts Carmel’s Shakespeare Festival each summer. In addition, the city’s city center for the arts, The Sunset Cultural Center, hosts the Carmel Bach Festival as well as year-round symphonies, chamber concerts, and various other performances.

Boasting a rich historical flavor, Carmel is home to such sites as the Carmel Mission Basilica and Museum. Located on Rio Road off Highway 1, California’s second mission was built in 1771. Carmel is also home to the crown jewel of the state park system, Point Lobos State Reserve. Located four miles south of Carmel, the reserve is a panoramic mile-long coastal strand of bold headlands, irregular coves, and rolling meadows.

Carmel Hills (30-day trend)
 
Number of Properties
Avg Price
Avg $/SQFT
Avg DOM
% of Avg Sold Price/Avg List Price
Active
0 (Number of Properties)
Carmel Woods (30-day trend)
 
Number of Properties
Avg Price
Avg $/SQFT
Avg DOM
% of Avg Sold Price/Avg List Price
Active
4 (Number of Properties)
$3,237,083 (Avg Price)
$1,410 (Avg $/SQFT)
135 (Avg DOM)
Sold
3 (Number of Properties)
$2,731,250 (Avg Price)
$1,169 (Avg $/SQFT)
97 (Avg DOM)
97% (% of Avg Sold Price/Avg List Price)
Carmel Point (30-day trend)
 
Number of Properties
Avg Price
Avg $/SQFT
Avg DOM
% of Avg Sold Price/Avg List Price
Active
3 (Number of Properties)
$9,442,592 (Avg Price)
$3,297 (Avg $/SQFT)
86 (Avg DOM)
Sold
2 (Number of Properties)
$5,903,658 (Avg Price)
$2,609 (Avg $/SQFT)
53 (Avg DOM)
99% (% of Avg Sold Price/Avg List Price)
High Meadows (30-day trend)
 
Number of Properties
Avg Price
Avg $/SQFT
Avg DOM
% of Avg Sold Price/Avg List Price
Active
0 (Number of Properties)
$1,092,250 (Avg Price)
$743 (Avg $/SQFT)
7 (Avg DOM)
Sold
2 (Number of Properties)
$857,230 (Avg Price)
$677 (Avg $/SQFT)
100 (Avg DOM)
99% (% of Avg Sold Price/Avg List Price)
Carmel Meadows (30-day trend)
 
Number of Properties
Avg Price
Avg $/SQFT
Avg DOM
% of Avg Sold Price/Avg List Price
Active
0 (Number of Properties)
Jack's Peak (30-day trend)
 
Number of Properties
Avg Price
Avg $/SQFT
Avg DOM
% of Avg Sold Price/Avg List Price
Active
0 (Number of Properties)
$2,055,000 (Avg Price)
$740 (Avg $/SQFT)
7 (Avg DOM)
Sold
0 (Number of Properties)
$1,470,000 (Avg Price)
$278 (Avg $/SQFT)
32 (Avg DOM)
147% (% of Avg Sold Price/Avg List Price)
Northeast Carmel (30-day trend)
 
Number of Properties
Avg Price
Avg $/SQFT
Avg DOM
% of Avg Sold Price/Avg List Price
Active
3 (Number of Properties)
$2,750,530 (Avg Price)
$1,866 (Avg $/SQFT)
67 (Avg DOM)
Sold
2 (Number of Properties)
$2,613,157 (Avg Price)
$1,173 (Avg $/SQFT)
107 (Avg DOM)
94% (% of Avg Sold Price/Avg List Price)
Northwest Carmel (30-day trend)
 
Number of Properties
Avg Price
Avg $/SQFT
Avg DOM
% of Avg Sold Price/Avg List Price
Active
1 (Number of Properties)
$3,631,575 (Avg Price)
$1,645 (Avg $/SQFT)
63 (Avg DOM)
Sold
0 (Number of Properties)
$2,500,000 (Avg Price)
$1,526 (Avg $/SQFT)
236 (Avg DOM)
84% (% of Avg Sold Price/Avg List Price)
Hatton Fields (30-day trend)
 
Number of Properties
Avg Price
Avg $/SQFT
Avg DOM
% of Avg Sold Price/Avg List Price
Active
6 (Number of Properties)
$3,482,567 (Avg Price)
$1,454 (Avg $/SQFT)
80 (Avg DOM)
Sold
1 (Number of Properties)
$4,302,941 (Avg Price)
$1,006 (Avg $/SQFT)
87 (Avg DOM)
93% (% of Avg Sold Price/Avg List Price)
Mission (30-day trend)
 
Number of Properties
Avg Price
Avg $/SQFT
Avg DOM
% of Avg Sold Price/Avg List Price
Active
0 (Number of Properties)
$0 (Avg Price)
$0 (Avg $/SQFT)
0 (Avg DOM)
Sold
0 (Number of Properties)
$0 (Avg Price)
$0 (Avg $/SQFT)
0 (Avg DOM)
0% (% of Avg Sold Price/Avg List Price)
Southeast Carmel (30-day trend)
 
Number of Properties
Avg Price
Avg $/SQFT
Avg DOM
% of Avg Sold Price/Avg List Price
Active
7 (Number of Properties)
$3,199,785 (Avg Price)
$2,347 (Avg $/SQFT)
52 (Avg DOM)
Sold
0 (Number of Properties)
$0 (Avg Price)
$0 (Avg $/SQFT)
0 (Avg DOM)
0% (% of Avg Sold Price/Avg List Price)
Southwest Carmel (30-day trend)
 
Number of Properties
Avg Price
Avg $/SQFT
Avg DOM
% of Avg Sold Price/Avg List Price
Active
7 (Number of Properties)
$5,291,936 (Avg Price)
$2,647 (Avg $/SQFT)
135 (Avg DOM)
Sold
2 (Number of Properties)
$5,335,085 (Avg Price)
$2,922 (Avg $/SQFT)
81 (Avg DOM)
98% (% of Avg Sold Price/Avg List Price)

Property Info