Direct Line 831.566.3127     Email Kathleen.manning@sothebys.realty     License: DRE# 00885315
Kathleen Manning

Kathleen Manning

Carmel Valley


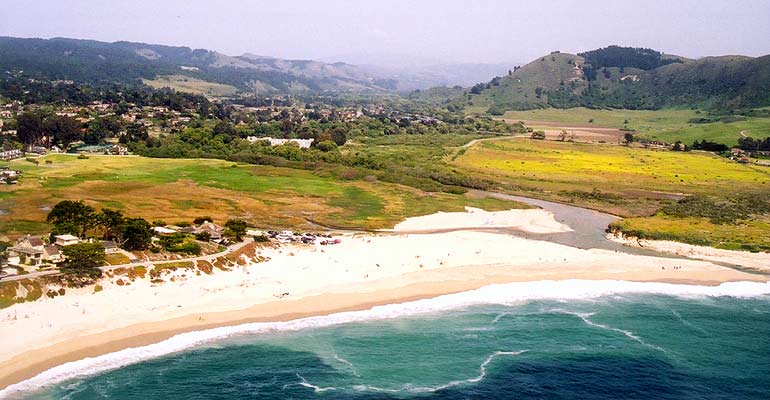
Carmel Valley is an unincorporated  township comprised of fertile valleys and sprawling ranches, located 12 miles east of Carmel. Located off Carmel Valley Road, this bucolic hamlet enjoys a rare small-town, rural atmosphere. Nestled in this uniquely pastoral setting, Carmel Valley boasts a charming, friendly downtown area.

As the center of Monterey County’s wine country, this area is home to several tasting rooms, fine resorts, and elegant restaurants. With its inland location and 283 days of sunshine each year, Carmel Valley had become known as the “sunbelt” of the Monterey Peninsula. Generally, the weather in Carmel Valley is warmer and sunnier than the rest of Monterey County.

Offering prime terrain and weather for golf, Carmel Valley is home to three championship golf courses; Carmel Valley Ranch Resort, Quail Lodge, and Rancho Canada. The Carmel River runs through the middle of Carmel Valley until it blends with the Pacific Ocean at Carmel Bay. Carmel Valley is home to Garland Ranch Regional Park. Situated in a pastoral, green meadow alongside the shimmering Carmel River, the park is home to rolling grasslands, dense oak woodlands, trails for hikers and horseback riders, and several animal habitats.

Brookdale (30-day trend)
 
Number of Properties
Avg Price
Avg $/SQFT
Avg DOM
% of Avg Sold Price/Avg List Price
Active
0 (Number of Properties)
$1,895,000 (Avg Price)
$699 (Avg $/SQFT)
6 (Avg DOM)
Sold
0 (Number of Properties)
$0 (Avg Price)
$0 (Avg $/SQFT)
0 (Avg DOM)
0% (% of Avg Sold Price/Avg List Price)
Carmel Valley Ranch (30-day trend)
 
Number of Properties
Avg Price
Avg $/SQFT
Avg DOM
% of Avg Sold Price/Avg List Price
Active
4 (Number of Properties)
$2,209,589 (Avg Price)
$900 (Avg $/SQFT)
161 (Avg DOM)
Sold
2 (Number of Properties)
$2,109,354 (Avg Price)
$914 (Avg $/SQFT)
104 (Avg DOM)
99% (% of Avg Sold Price/Avg List Price)
Carmel Valley Village/Los Tulare (30-day trend)
 
Number of Properties
Avg Price
Avg $/SQFT
Avg DOM
% of Avg Sold Price/Avg List Price
Active
5 (Number of Properties)
$1,730,100 (Avg Price)
$826 (Avg $/SQFT)
180 (Avg DOM)
Sold
2 (Number of Properties)
$1,342,307 (Avg Price)
$878 (Avg $/SQFT)
26 (Avg DOM)
100% (% of Avg Sold Price/Avg List Price)
Carmel Views / Rancho Rio Vista (30-day trend)
 
Number of Properties
Avg Price
Avg $/SQFT
Avg DOM
% of Avg Sold Price/Avg List Price
Active
3 (Number of Properties)
$3,021,466 (Avg Price)
$878 (Avg $/SQFT)
28 (Avg DOM)
Sold
1 (Number of Properties)
$2,086,000 (Avg Price)
$1,032 (Avg $/SQFT)
60 (Avg DOM)
96% (% of Avg Sold Price/Avg List Price)
Hacienda / Del Mesa (30-day trend)
 
Number of Properties
Avg Price
Avg $/SQFT
Avg DOM
% of Avg Sold Price/Avg List Price
Active
7 (Number of Properties)
$997,996 (Avg Price)
$797 (Avg $/SQFT)
64 (Avg DOM)
Sold
4 (Number of Properties)
$1,051,480 (Avg Price)
$725 (Avg $/SQFT)
56 (Avg DOM)
98% (% of Avg Sold Price/Avg List Price)
Mid Valley (30-day trend)
 
Number of Properties
Avg Price
Avg $/SQFT
Avg DOM
% of Avg Sold Price/Avg List Price
Active
1 (Number of Properties)
$1,669,000 (Avg Price)
$1,087 (Avg $/SQFT)
705 (Avg DOM)
Sold
2 (Number of Properties)
$2,414,347 (Avg Price)
$671 (Avg $/SQFT)
200 (Avg DOM)
94% (% of Avg Sold Price/Avg List Price)
Miramonte (30-day trend)
 
Number of Properties
Avg Price
Avg $/SQFT
Avg DOM
% of Avg Sold Price/Avg List Price
Active
3 (Number of Properties)
$1,986,000 (Avg Price)
$702 (Avg $/SQFT)
129 (Avg DOM)
Sold
0 (Number of Properties)
$3,175,000 (Avg Price)
$1,087 (Avg $/SQFT)
266 (Avg DOM)
98% (% of Avg Sold Price/Avg List Price)
Quail Meadows/The Preserve (30-day trend)
 
Number of Properties
Avg Price
Avg $/SQFT
Avg DOM
% of Avg Sold Price/Avg List Price
Active
2 (Number of Properties)
$5,197,575 (Avg Price)
$1,322 (Avg $/SQFT)
59 (Avg DOM)
Sold
1 (Number of Properties)
$3,200,000 (Avg Price)
$1,103 (Avg $/SQFT)
46 (Avg DOM)
100% (% of Avg Sold Price/Avg List Price)
Tierra Granda/Tehama (30-day trend)
 
Number of Properties
Avg Price
Avg $/SQFT
Avg DOM
% of Avg Sold Price/Avg List Price
Active
2 (Number of Properties)
$3,294,207 (Avg Price)
$1,110 (Avg $/SQFT)
135 (Avg DOM)
Sold
0 (Number of Properties)
$0 (Avg Price)
$0 (Avg $/SQFT)
0 (Avg DOM)
0% (% of Avg Sold Price/Avg List Price)
Upper Valley/Cachagua (30-day trend)
 
Number of Properties
Avg Price
Avg $/SQFT
Avg DOM
% of Avg Sold Price/Avg List Price
Active
8 (Number of Properties)
$2,087,900 (Avg Price)
$880 (Avg $/SQFT)
115 (Avg DOM)
Sold
1 (Number of Properties)
$975,000 (Avg Price)
$304 (Avg $/SQFT)
214 (Avg DOM)
98% (% of Avg Sold Price/Avg List Price)
Village Views (30-day trend)
 
Number of Properties
Avg Price
Avg $/SQFT
Avg DOM
% of Avg Sold Price/Avg List Price
Active
7 (Number of Properties)
$3,588,571 (Avg Price)
$981 (Avg $/SQFT)
105 (Avg DOM)
Sold
0 (Number of Properties)
$0 (Avg Price)
$0 (Avg $/SQFT)
0 (Avg DOM)
0% (% of Avg Sold Price/Avg List Price)

Property Info