Direct Line 831.566.3127     Email Kathleen.manning@sothebys.realty     License: DRE# 00885315
Kathleen Manning

Kathleen Manning

Marina


Incorporated in 1975, the City of Marina is the youngest of the Monterey Peninsula communities. The city enjoys an idyllic, coastal location, situated on a series of gently rolling hills just minutes from Monterey, Pacific Grove, and Carmel. Marina’s scenic terrain complements the city’s several parks and public recreation facilities.

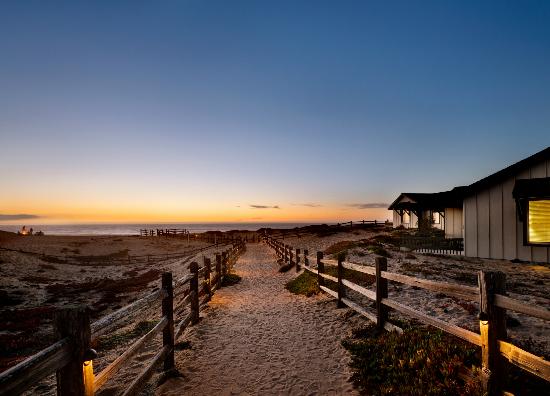
Most notably, Marina is home to Marina State Beach, one of the county’s most popular shoreline destinations. The area offers an endless stretch of sandy beach as well as a meandering boardwalk through the scenic Marina Dunes Natural Preserve. Locke-Paddon Park, in Marina, is one of the few remaining wetland preserves in North America and is a popular destination for bird watchers, hikers, and naturalists.

Marina is also home to the former Fort Ord. With its 8,000 acres now deeded to the Bureau of Land Management, the area includes a large conservancy offering public hiking, mountain biking, and horseback riding trails. Visitors will also enjoy blooming wildflowers in the spring as well as waterfowl, shore birds, and other wildlife. The beach and the surrounding areas, with their breezy coastal climate, are also popular with air sport enthusiasts. While Marina State Beach is known for hang-gliding, the Marina Municipal Airport offers sail planes, ballooning, skydiving, and helicopter rides.

Cardoza (30-day trend)
 
Number of Properties
Avg Price
Avg $/SQFT
Avg DOM
% of Avg Sold Price/Avg List Price
Active
2 (Number of Properties)
$1,117,130 (Avg Price)
$670 (Avg $/SQFT)
12 (Avg DOM)
Sold
1 (Number of Properties)
$1,021,076 (Avg Price)
$695 (Avg $/SQFT)
45 (Avg DOM)
103% (% of Avg Sold Price/Avg List Price)
Locke Paddon (30-day trend)
 
Number of Properties
Avg Price
Avg $/SQFT
Avg DOM
% of Avg Sold Price/Avg List Price
Active
1 (Number of Properties)
$649,000 (Avg Price)
$433 (Avg $/SQFT)
14 (Avg DOM)
Sold
1 (Number of Properties)
$810,000 (Avg Price)
$457 (Avg $/SQFT)
51 (Avg DOM)
96% (% of Avg Sold Price/Avg List Price)
Lower Reindoller (30-day trend)
 
Number of Properties
Avg Price
Avg $/SQFT
Avg DOM
% of Avg Sold Price/Avg List Price
Active
0 (Number of Properties)
$0 (Avg Price)
$0 (Avg $/SQFT)
0 (Avg DOM)
Sold
1 (Number of Properties)
$894,595 (Avg Price)
$554 (Avg $/SQFT)
33 (Avg DOM)
100% (% of Avg Sold Price/Avg List Price)
Middle Marina (30-day trend)
 
Number of Properties
Avg Price
Avg $/SQFT
Avg DOM
% of Avg Sold Price/Avg List Price
Active
0 (Number of Properties)
$0 (Avg Price)
$0 (Avg $/SQFT)
0 (Avg DOM)
Sold
1 (Number of Properties)
$755,000 (Avg Price)
$650 (Avg $/SQFT)
56 (Avg DOM)
100% (% of Avg Sold Price/Avg List Price)
Montrery Bay Estates (30-day trend)
 
Number of Properties
Avg Price
Avg $/SQFT
Avg DOM
% of Avg Sold Price/Avg List Price
Active
1 (Number of Properties)
$895,000 (Avg Price)
$536 (Avg $/SQFT)
5 (Avg DOM)
Sold
2 (Number of Properties)
$930,428 (Avg Price)
$517 (Avg $/SQFT)
33 (Avg DOM)
101% (% of Avg Sold Price/Avg List Price)
Seacrest/Mortimer (30-day trend)
 
Number of Properties
Avg Price
Avg $/SQFT
Avg DOM
% of Avg Sold Price/Avg List Price
Active
2 (Number of Properties)
$480,375 (Avg Price)
$456 (Avg $/SQFT)
101 (Avg DOM)
Sold
0 (Number of Properties)
$745,500 (Avg Price)
$534 (Avg $/SQFT)
385 (Avg DOM)
100% (% of Avg Sold Price/Avg List Price)
Upper Carmel (30-day trend)
 
Number of Properties
Avg Price
Avg $/SQFT
Avg DOM
% of Avg Sold Price/Avg List Price
Active
2 (Number of Properties)
$1,231,250 (Avg Price)
$613 (Avg $/SQFT)
6 (Avg DOM)
Sold
0 (Number of Properties)
$0 (Avg Price)
$0 (Avg $/SQFT)
0 (Avg DOM)
0% (% of Avg Sold Price/Avg List Price)
Upper Reindoller (30-day trend)
 
Number of Properties
Avg Price
Avg $/SQFT
Avg DOM
% of Avg Sold Price/Avg List Price
Active
0 (Number of Properties)
$0 (Avg Price)
$0 (Avg $/SQFT)
0 (Avg DOM)
Sold
0 (Number of Properties)
$735,000 (Avg Price)
$499 (Avg $/SQFT)
31 (Avg DOM)
107% (% of Avg Sold Price/Avg List Price)
Vista Del Camino (30-day trend)
 
Number of Properties
Avg Price
Avg $/SQFT
Avg DOM
% of Avg Sold Price/Avg List Price
Active
1 (Number of Properties)
$899,000 (Avg Price)
$723 (Avg $/SQFT)
2 (Avg DOM)
Sold
1 (Number of Properties)
$810,000 (Avg Price)
$444 (Avg $/SQFT)
94 (Avg DOM)
104% (% of Avg Sold Price/Avg List Price)

Property Info