Direct Line 831.566.3127     Email Kathleen.manning@sothebys.realty     License: DRE# 00885315
Kathleen Manning

Kathleen Manning

Seaside/Sand City


The burgeoning community of Sand City is situated just north of Seaside and enjoys a great location overlooking the waters of Monterey Bay. A community that harmonizes residential neighborhoods with prime commercial districts, Sand City is home to popular shopping areas like Sand Dollar Plaza and Edgewater on Monterey Bay. These retail centers are even more successful because they represent the only regional retail centers on the Monterey Peninsula. The city also boasts a light industrial park that consists of relatively small manufacturing businesses. Although the resident population of Sand City is just over 200, more than 4,000 people travel here for employment.

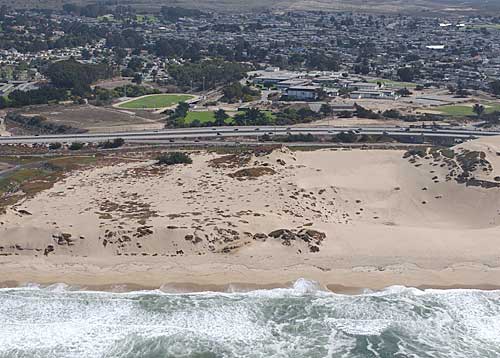
Sand City derives its name from the rolling, sandy dunes that line the community and the sand-mining operations that once took place along the shoreline. Remnants of dunes that once stretched as far inland as the Salinas Valley, this unique sand dune landscape rises as high as 50 feet in some places. Additionally, the city boasts 1.5 miles of pristine coastline as well as a scenic coastal recreation trail.

Looking to the future, Sand City is being re-planned for an ultimate permanent population of 1,300. The city is taking advantage of its ideal bayside location as it continues to cultivate its reputation as a retail and resort destination.

LaSalle/Ord Grove (30-day trend)
 
Number of Properties
Avg Price
Avg $/SQFT
Avg DOM
% of Avg Sold Price/Avg List Price
Active
0 (Number of Properties)
$850,000 (Avg Price)
$731 (Avg $/SQFT)
1 (Avg DOM)
Sold
1 (Number of Properties)
$768,909 (Avg Price)
$529 (Avg $/SQFT)
32 (Avg DOM)
96% (% of Avg Sold Price/Avg List Price)
Lower Broadway (30-day trend)
 
Number of Properties
Avg Price
Avg $/SQFT
Avg DOM
% of Avg Sold Price/Avg List Price
Active
3 (Number of Properties)
$863,103 (Avg Price)
$643 (Avg $/SQFT)
43 (Avg DOM)
Sold
2 (Number of Properties)
$668,636 (Avg Price)
$620 (Avg $/SQFT)
128 (Avg DOM)
102% (% of Avg Sold Price/Avg List Price)
Lower Kimball (30-day trend)
 
Number of Properties
Avg Price
Avg $/SQFT
Avg DOM
% of Avg Sold Price/Avg List Price
Active
0 (Number of Properties)
$849,000 (Avg Price)
$731 (Avg $/SQFT)
4 (Avg DOM)
Sold
1 (Number of Properties)
$935,930 (Avg Price)
$751 (Avg $/SQFT)
46 (Avg DOM)
100% (% of Avg Sold Price/Avg List Price)
Mid Broadway (30-day trend)
 
Number of Properties
Avg Price
Avg $/SQFT
Avg DOM
% of Avg Sold Price/Avg List Price
Active
6 (Number of Properties)
$876,830 (Avg Price)
$790 (Avg $/SQFT)
15 (Avg DOM)
Sold
0 (Number of Properties)
$500,000 (Avg Price)
$557 (Avg $/SQFT)
22 (Avg DOM)
91% (% of Avg Sold Price/Avg List Price)
Sand City (30-day trend)
 
Number of Properties
Avg Price
Avg $/SQFT
Avg DOM
% of Avg Sold Price/Avg List Price
Active
1 (Number of Properties)
$1,998,888 (Avg Price)
$745 (Avg $/SQFT)
20 (Avg DOM)
Sold
0 (Number of Properties)
$0 (Avg Price)
$0 (Avg $/SQFT)
0 (Avg DOM)
0% (% of Avg Sold Price/Avg List Price)
Trinity/Palm (30-day trend)
 
Number of Properties
Avg Price
Avg $/SQFT
Avg DOM
% of Avg Sold Price/Avg List Price
Active
1 (Number of Properties)
$759,000 (Avg Price)
$643 (Avg $/SQFT)
4 (Avg DOM)
Sold
0 (Number of Properties)
$985,000 (Avg Price)
$333 (Avg $/SQFT)
38 (Avg DOM)
111% (% of Avg Sold Price/Avg List Price)
Upper Broadway/Mescal (30-day trend)
 
Number of Properties
Avg Price
Avg $/SQFT
Avg DOM
% of Avg Sold Price/Avg List Price
Active
0 (Number of Properties)
$1,300,000 (Avg Price)
$739 (Avg $/SQFT)
1 (Avg DOM)
Sold
1 (Number of Properties)
$1,028,909 (Avg Price)
$677 (Avg $/SQFT)
22 (Avg DOM)
107% (% of Avg Sold Price/Avg List Price)
Upper Kimball (30-day trend)
 
Number of Properties
Avg Price
Avg $/SQFT
Avg DOM
% of Avg Sold Price/Avg List Price
Active
0 (Number of Properties)
$1,388,888 (Avg Price)
$835 (Avg $/SQFT)
17 (Avg DOM)
Sold
0 (Number of Properties)
$962,500 (Avg Price)
$685 (Avg $/SQFT)
47 (Avg DOM)
101% (% of Avg Sold Price/Avg List Price)

Property Info